How much do you log (in your application)? Do you use tools like Bunyan to make your logs easier to read? Do you Stringify everything and print it straight to console.log()? If so, logging may be the reason why you’re having trouble reducing your app’s average route response time to under 200ms.
When we first started implementing a unified logging system throughout our API, we didn’t anticipate how something as simple as logging to console could possibly slow down our system. Our data models were in their infancy; they barely had actual data on them, so it became common to just Stringify the whole object into the log. It sounded like such a great idea! Investigating bugs was easier since we had a record of the entire data object during each step of our flow.
But then things started to change…
We started adding more and more logging points. As our code grew, we kept logging more information at each point to help us differentiate our services and servers. Our models started getting bigger and more complicated. Logs became unreadable without Bunyan. Things started to slow, and eventually crash.
While investigating, I discovered that some of our models that were printed were bigger than we realized — megabytes in size. We were logging our API to death.
Let’s look at some real data. I wrote a quick test service to simulate the behavior we encountered. The source is on GitHub, and you can follow along on CodeSnippets.
In this server, we build random objects composed of smaller random objects. The objects have 1 × 10factor properties that are populated with sub-objects with (factor − 1) and (depth − 1). If we set factor to 2 and depth to 2, for example, it creates an object like the following:
{
…,
Asdasd: { A58l9Zdq1rwWBzJBug4C4eKS819PE7vX:
            'Q3aOBm12OotXH5jGufzCWHavYig5NKi6',

          h5g22j8F5Uhz3A9P7cDaJ7sZmeClTaa4:
            'Ee6fYDuJ8h3qc2XOa0UrgXKYK3We8T8l',

          hmeF3ioaK3qmYDBrzV9SyqBLEqeXzzZA:
            'KSO49hY6IF1MGJ9rUW5VE64pBPno3Fug',

          4mnjGaKOKwU8UivpB1Oe0MmJHl27aUuu:
            'jr9F3xaidNzDbI2QiNWfHmOhZzxfUYWy',

          ceKohqISTdHGYsle3tjoCRrykEuS1W9z:
            'dj4GowLtKkEs37vKOnXvyQB3LHO0UILo',

          f3RSbiRkH7ZpGt7sr3YpL4yZH4303Fl5:
            'Fyc4h26TA7ZQXjq32msHs29r4r6GHzEt',

          UcT62S4c2936jKmpWeuauu2hLPFVdzew:
            '53yKqZ3fv0ani85h9T6rR5KlQFdGDZUf',

          MEDZFg4j6yRlwXpPVaiVZPmVFO65Wat9:
            'fpaD1DEz60Cuxm35MFLQcr70xlOsNiru',

          0YFWUo1RYh6UiUsEv7ykoXBGUn4m01jw:
            'VBPEDxSBirAaG8tKx1wIGCVngE4DRNL0',

          gmw47dnOv27gsbpWu1iUIuMVslI47Eo4:
            'I5R9ZQWCRDPVVn2kb2IOXi9dHrH7NFRh' },
          …
},
A sub-object containing 10 properties. The parent object contains 100 of these.
Let’s try something ridiculous, just to illustrate: Factor 3, Depth 3. You can test this on the CodeSnippet by running the server, and adjusting the query parameters in the sandbox URL: /diy?factor=3&depth=3&random=true. Because of how much work this request will do, you may need to try it multiple times to beat the timeout.
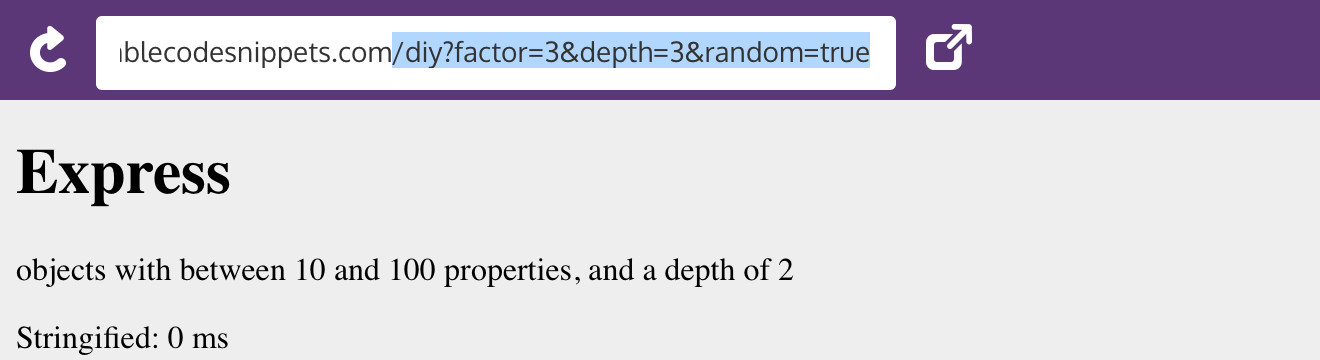
If you’re following along, place the query parameter here.
The random parameter simulates a random number of properties (with the factor being the max). This property is actually enabled by default for factors over 3.
Depth is the important property to play with, as that illustrates issues that stem from sizable objects containing even more sizable objects. Try it a few times. If it fails on you, just refresh the page. The container given to you runs on a decently spec’d (quad-core) server, so Stringify should take under 200ms.
Look at that result. I got around 450ms — almost half a second to take an object you may be passing through your middleware and turn it into a string. That means the node event loop will be completely busy making a string; it won’t be able to respond to anything while it’s happening. Not even IO operations are getting through. Not to mention memory allocation!
While this is a very extreme example, it does serve as a demonstration of just how bad it could get if left unchecked. This could easily happen if your application is printing out the contents of the request object that handles file uploads.
How about a more realistic example? /diy?factor=2&depth=15. The objects I frequently work with tend to have many nested objects inside, which sometimes contain even more nested objects. Running this test, my result was around 10ms. Much more realistic. Now, you may be asking, “What’s wrong with just 10ms?” If you Stringify that object five times in one route, you’re already a quarter of the way to a sub-optimal response time. These issues can snowball before you even realize it! How much time are you wasting?
Stringifying objects in JS can be incredibly helpful for finding issues throughout your app. However, if left unchecked, it can be devastating to your app’s performance. Don’t be like the NSA, collecting every piece of data possible, then trying to sift through it later. Unless you are the NSA, then by all means, stringify every possible thing. Everyone else: be smart about what you log, plan ahead, and never Stringify objects that you don’t fully understand.